
This page explains the basics of block diagrams and how to read a block diagram of a feedback control system. It also explains control terminologies associated with block diagrams.
- A block diagram is a diagrammatic representation of a system configuration.
- It is especially useful when sharing overall system configuration with others.
- As long as the basic rules are observed, the expression can be changed (i.e. the expressions are flexible.)
What is Block Diagram?
Components of Block Diagrams
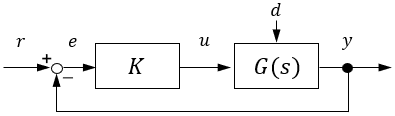
When you hear the word “control engineering,” you may imagine a block diagram like this:
A block diagram is a graphical representation of system configuration. It is mainly used to record or share system configurations with others.
In a block diagram, the blocks represent systems, and the arrows represent signals. Broadly put, you can think of a block as something you can touch and an arrow as something you can’t (although there are many exceptions).
A system receives some input signal from time to time and returns some output signal in response. This is represented by the block and arrows as shown below:
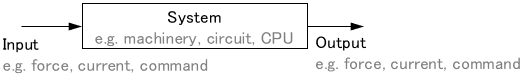
In control engineering, an input signal and an output signal are mostly referred to simply as an input and an output.
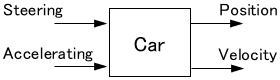
Sometimes a system has multiple inputs and outputs, like this:
System Representation
An equation that represents system characteristics (i.e. input-output relationships) is called a mathematical model (or simply a model). In control engineering, the essence of a system is a mathematical model.
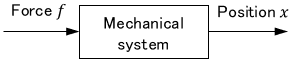
Mathematical models are mostly expressed by differential equations. For example, as is well known, a mathematical model of the following mechanical system is represented by a differential equation called the equation of motion.
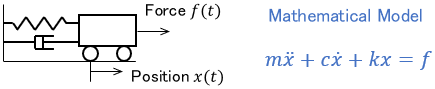
This can be interpreted as a system in which the cart receives the force and changes its position. So the input of this system is force $f(t)$, and the output is position $x(t)$.
Let’s draw a block diagram of this system. We can represent the system as a block and the input and output signals as arrows, as follows.
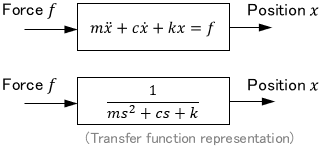
Incidentally, there are no strict rules about what to write in the blocks. Almost any representation is acceptable as long as it conveys what the system is.
It is common for the name of the system to be written, as shown above, or for the mathematical model of the system to be written, as shown below:
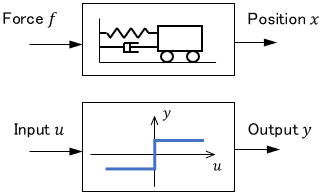
Also, for ease of understanding, an illustration of the system or a graph showing input-output relationships are sometimes drawn.
Signal Representation
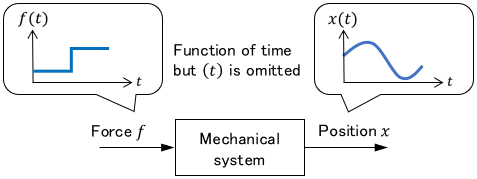
As mentioned earlier, arrows represent signals. They are written with a signal name or a symbol such as $x$.
Since signals change from time to time, they are all functions of time. But on a block diagram, for simplicity, they are often represented simply as $x$ instead of $x(t)$.
If we want to input one signal to multiple systems, we can branch the arrows as follows:
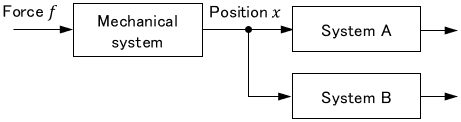
Branching an arrow does not halve the signal. Simply think that one signal is shared by multiple systems.
When adding or subtracting multiple signals, combine the arrows as follows:
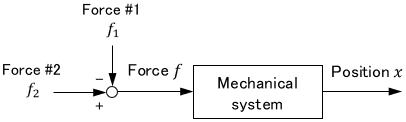
The + and – can be written anywhere as long as it is clear which signal is being added or subtracted.
Block Diagram of Feedback Control System and Control Terminology
Example
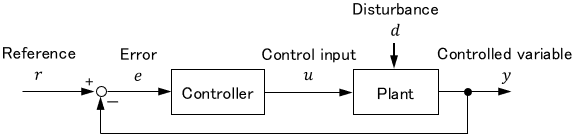
Now, let’s get a deeper understanding by reading a block diagram of a feedback control system, which is a typical block diagram.
Some important systems and signals in feedback control have specific names. Let’s learn about those control terms as well.
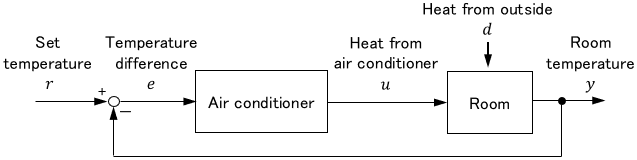
As an example, consider the following room temperature control by an air conditioner.
Let’s see the mechanism of how this system works, step by step.
Note: For an overview of feedback control, please see this page:

Signal Flow around the Plant
First, we will focus on the control target and the signals around it. In control engineering, a control target is called a plant (regardless of size). A plant is the main part of a system. In our example, the plant is the room.
What we want to control now is the room temperature. Since room temperature is room information, it is represented as an output of the room. Such a signal, which is the objective of the control, is called a controlled variable. (Often simply called “output.”)
On the other hand, what acts on the room to regulate the room temperature is the heat from the air conditioner. So this works as an input to the room. Such an input given to a plant to regulate a controlled variable is called a control input. (Often simply called “control” or “input.”)
But not only heat from the air conditioner, but also heat from outside affects the room temperature. Such unintended input acting on a system is called a disturbance.
Signal Flow around the Controller
Next, let’s look at the central part of the control, the air conditioner.
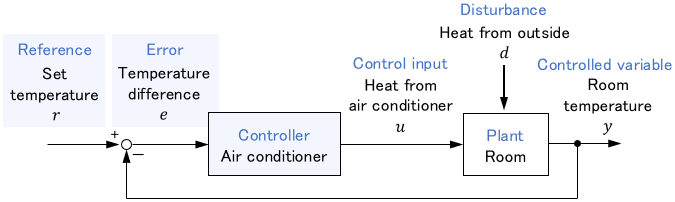
The role of the air conditioner is to supply heat to the room according to the current room temperature. Such a system that generates control inputs is called a controller.
The output from the air conditioner is heat. This is then given as a control input to the room, which is the plant.
On the other hand, the input to the air conditioner is the temperature difference between the set and room temperature. Based on this, the amount of heat $u$ is determined. In control engineering, the set temperature is called the reference, and the temperature difference is called the error.
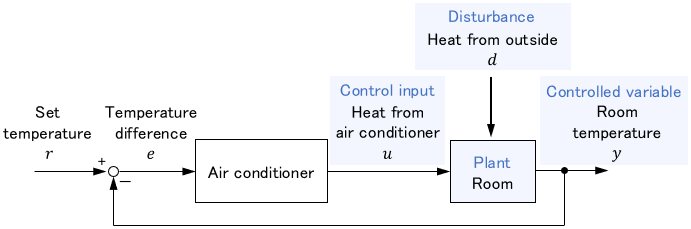
A block diagram summarizing the above terms is shown here.
| Terminology | Common symbol | Meaning | Sometimes also called |
|---|---|---|---|
| Plant | System to be controlled | Process | |
| Controlled variable | $y$ | Output from plant | Output |
| Control input | $u$ | Input given to plant | Control or Input |
| Disturbance | $d$ | Unintended input | Noise |
| Controller | System that generates control input | ||
| Reference | $r$ | Desired controlled variable | |
| Error | $e$ | Difference between reference and controlled variable |
Reasons for using Block Diagrams
It’s kind of abstract and a little difficult to understand…
Why bother using such a diagram?
In practical use, block diagrams are often used to share an overall system configuration with others. It is especially useful when the system configuration is complex.
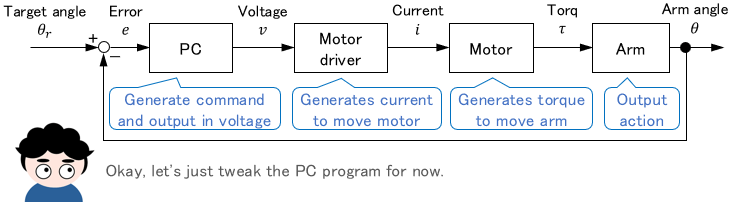
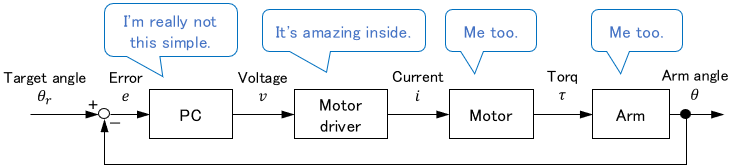
For example, let’s say you have been given a task to control a robot arm. Since the robot arm is operated by various devices and programs working together, if you are just handed the equipment as it is, you would have no idea how to handle it, would you?

In such a situation, if a block diagram of the system is also shared, you can visually understand the overall system configuration and signal flow.
More specifically, you can see how each device/program works together and which ones you need to modify. That’s a big help!
The block diagram above mainly shows the hardware configuration, but block diagrams are also used to show a control theory configuration (or logic), like the following:
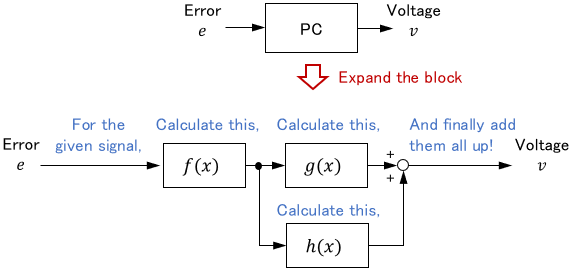
Level of Detail
Since block diagrams are used to share system configurations with others, you can adjust the level of detail depending on the purpose.
For example, in the block diagram of the robot arm, the internals of the PC and motor drivers were not shown intentionally. This made it easy to understand how each device worked together to make the whole work.
Also, when dealing with a large system of which even the robot is a part, for example, it would be easier to understand if the entire robot system is put together in one block.
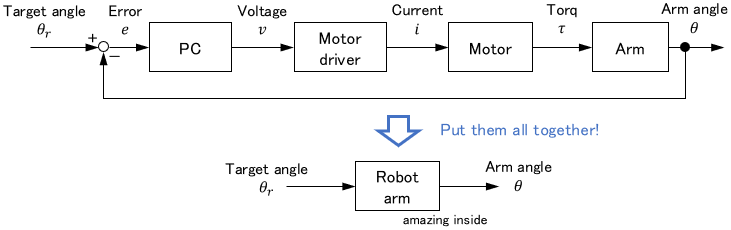
As explained above, you can be flexible in changing the expression of block diagrams to suit your purpose.
- A block diagram is a diagrammatic representation of a system configuration.
- It is especially useful when sharing overall system configuration with others.
- As long as the basic rules are observed, the expression can be changed (i.e. the expressions are flexible.)
Comments